Xfactor surfaces the cheat codes hidden in your revenue data.
Stop drowning in dashboards. Our AI agents pinpoint the few small changes that materially move your revenue number and turn them into a clear order of attack.
What if you could test your biggest revenue decisions before you made them?
Xfactor builds a live digital twin of your go-to-market operations — so you can simulate outcomes before you commit, catch what's drifting before it costs you, and act with confidence instead of instinct.

A live simulation engine for your revenue operations.
Not another dashboard.
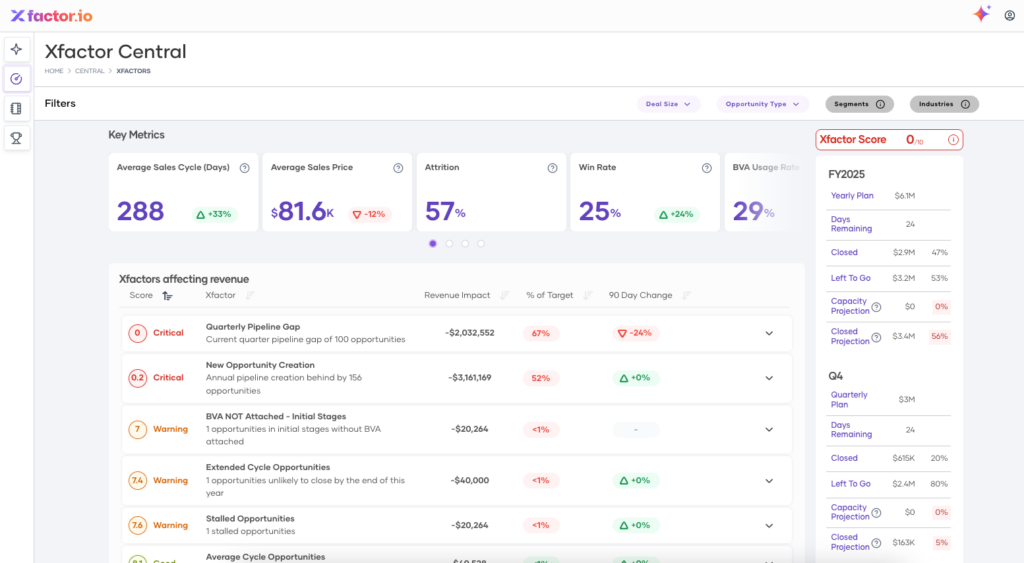
Xfactor connects every signal — CRM, pipeline, usage, customer success, finance, support — into one unified model that shows you what's happening and why.
It maps how signals influence each other — revealing what is actually driving performance across the business. Not correlations. True cause and effect.
This is not general purpose AI. Xfactor is purpose-built for revenue execution — your definitions, your model, your business logic baked in. Same result, always.
Trusted by industries across the country


Why are conversions down even though your pipeline and rep activity are up?
No tool in your stack can answer that. Your revenue signals live across seven different systems. Each one sees a slice. CRM sees pipeline. CS sees tickets. Finance sees lagging outcomes. Ask a question that crosses two of those systems and you get two different answers — or a three-day analysis project.
The result: you are not operating on reality. You are operating on the version of reality each system shows you — and the gaps between them are where misses hide. When the board asks why you missed, you can report what happened. You cannot explain why. And you cannot prove the next quarter will be different.
Your plan is only as good as what you can pressure-test
The plan goes stale
Your plan was built on last quarter's data. By Q2, the assumptions are wrong, but the targets are committed and the budget is locked.
Debates replace decisions
Without a shared model, every cross-functional meeting becomes an argument about which number is right. Decisions slow. Quarters drift.
Simulation restores control
Xfactor surfaces leading indicators weeks before they hit the forecast, so you manage the system, not the fallout from it.


Why firefighting kills strategy
Replaces strategy

Deal-by-deal planning
Without early signals, strategy gives way to guesswork. Leaders manage deals instead of shaping the quarter.

Early insight restores control
Xfactor surfaces critical issues weeks earlier, enabling teams to manage the system—not scramble over deals.

Xfactor
Why it exists

A digital twin is a living replica of your go-to-market system — continuously fed by data, reflecting what is happening, predicting what happens next.
We don’t replace your stack. We become the engine it feeds.
Xfactor
Central
Subtitle coms here
Builds a living model of your revenue engine — connecting every signal into one operating picture your exec and ops teams share. Live in 48 hours.
Xfactor
OpenInsights
Subtitle coms here
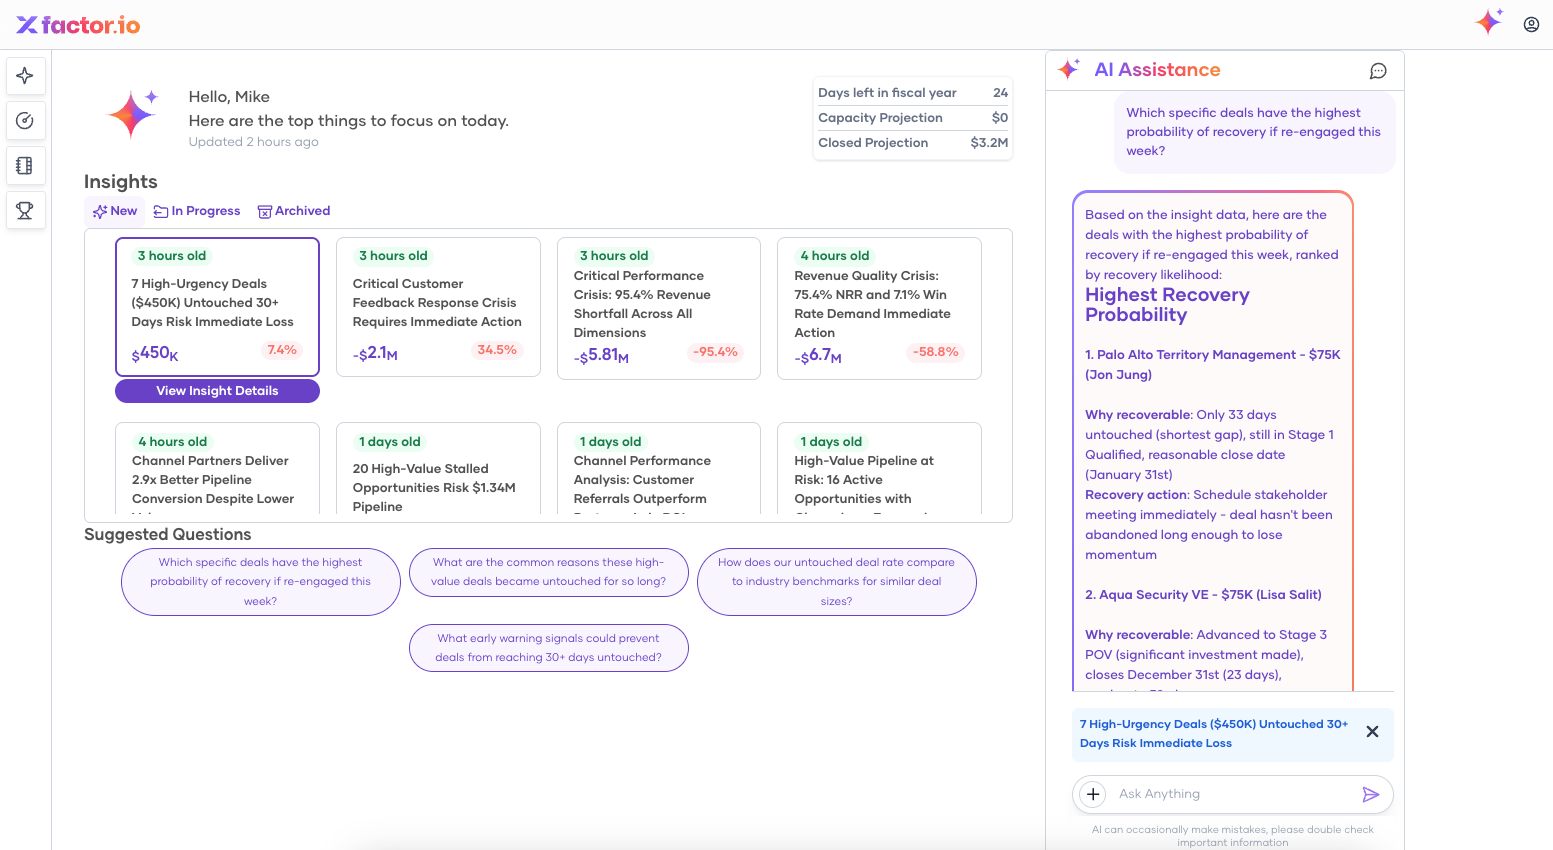
Surfaces cross-source risk in plain English — identifying what’s driving outcomes before they hit your forecast, renewal, or expansion numbers.
Xfactor
Simulation
Subtitle coms here
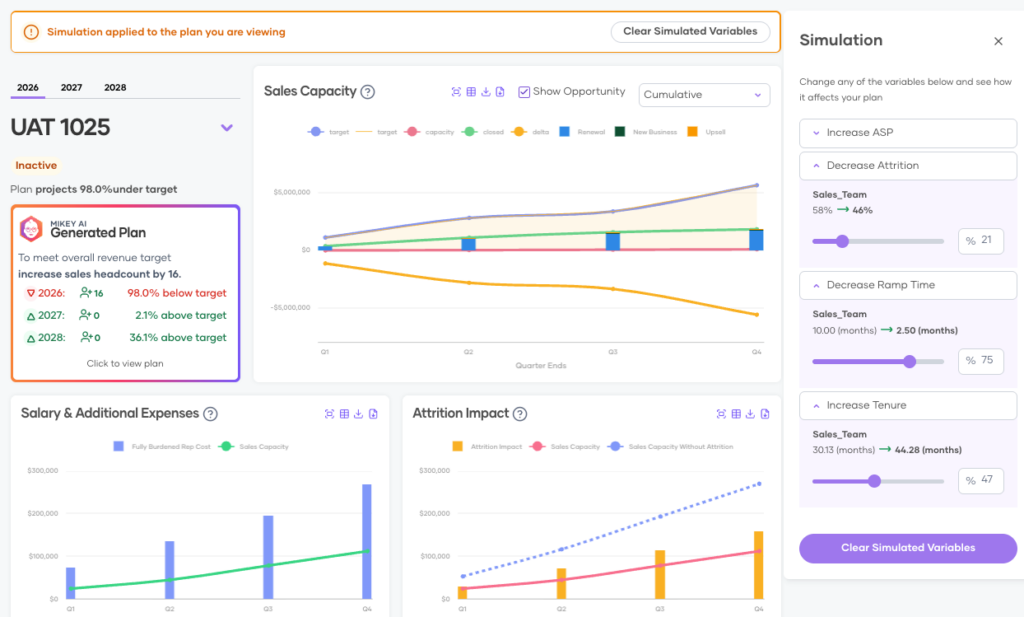
Tests growth scenarios before you commit — compare paths by projected impact, effort required, and time to value. Then choose with confidence.
See clearly. Decide early. Act with confidence.
From simulation to execution to measurable ROI — the complete loop.
Sample Report
Executive Summary
Your opportunity portfolio shows strong pipeline coverage at 101% of target ($25.0M vs $24.6M goal), but reveals critical execution risks that threaten revenue achievement. While renewal performance is excellent (84.8% win rate), new business struggles at 10.9% win rate and 79.6% of pipeline is aging beyond healthy thresholds. Immediate intervention is required on deal progression and lead conversion.
Current Pipeline Health
Coverage & Distribution
- Total Pipeline: $25.0M (181 opportunities)
- Target Achievement: 101.4% coverage
- Average Deal Size: $169,600
- Forecast Confidence: $14.0M high confidence (Commit + Best Case)
Opportunity Mix
- Existing Business: $12.5M (50.2%) – Highest value segment
- New Business: $10.9M (43.8%) – Volume driver but low conversion
- Renewals: $1.4M (5.4%) – Highest win rate at 84.8%
Stage Distribution
- Buyer Discovery: 65 deals (36.1%) – Major bottleneck
- POV: 28 deals (15.6%) – Critical conversion stage
- Qualification: 26 deals (14.3%)
- Negotiation/Purchasing: 27 deals (15.0%) – High confidence
Critical Risk Factors
1. Pipeline Aging Crisis
- $13.0M at severe risk (64 deals >365 days old)
- 79.6% of pipeline aging (144 deals >180 days)
- Oldest deal: 3.8 years old (Major Automotive Mfg – $54K)
- Average aged deal: 1,200+ days
2. New Business Performance Emergency
- 10.9% win rate vs 47.2% for Existing Business
- $10.9M pipeline with historically poor conversion
- Lead conversion down 67% QoQ (critical trend)
3. Value Proposition Gap
- 44 deals without BVA in early stages (-$89K capacity impact)
- Only 4.6% BVA attachment rate overall
- 2 late-stage deals without value props (Critical score: 6.9)
4. Activity & Engagement Issues
- 39 deals with no recent activity (-$79K capacity impact)
- 17 stalled opportunities identified by XFactors
- 1,187 cold leads requiring immediate attention
Performance Benchmarks
Win Rate Analysis (Trailing 12 Months)
- Overall: 35.8% (597 won / 1,665 total)
- By Type: Renewals 84.8% | Existing Business 47.2% | New Business 10.9%
- Trend: Win rate down 18.5% QoQ
Sales Cycle Metrics
- Average Cycle: 266 days (up 0.4% QoQ)
- By Stage: Discovery 119 days | Qualification 51 days | POV 24 days
- Risk Threshold: >180 days in any stage = 75%+ loss rate
Deal Size Performance
- Average Won Deal: $251,600 (median: $29,200)
- Large Deals (≥$615K): 26 deals = 76.7% of total won value
- Revenue Concentration: Heavy dependence on mega-deals
Top Opportunities & Risks
High-Confidence Deals ($14.0M)
Commit Category ($2.8M):
- National Bank: $215K (Stage 6 – Purchasing)
- Global Construction Firm: $36K combined (Stage 5 – Negotiation)
Best Case Category ($11.3M):
- Multiple POV stage deals requiring close monitoring
- Strong conversion history in this category (100% accuracy)
At-Risk Mega Deals
- Global Consultants: $31K (720 days old, no recent activity)
- Food Services Dist.: $200K (390 days in Stage 1)
- Healthcare Network: $186K (502 days old)
Strategic Recommendations
Immediate Actions (0-30 days)
- Pipeline Cleanup Blitz
- Review all 64 deals >365 days old
- Close/qualify 50% to focus resources
- Impact: +$6.5M pipeline quality improvement
- Value Proposition Emergency
- Attach BVAs to 44 early-stage deals immediately
- Prioritize 2 late-stage deals without value props
- Impact: +15-20% win rate improvement
- Activity Acceleration
- Immediate outreach on 39 inactive deals
- Daily check-ins on stalled opportunities
- Impact: Prevent $2.5M+ pipeline loss
Process Optimization (30-90 days)
- New Business Strategy Overhaul
- Implement discovery methodology training
- Create qualification frameworks
- Target: Improve 10.9% win rate to 20%+
- Lead Conversion Recovery
- Address 67% QoQ decline in conversion
- Implement lead scoring and routing
- Target: Convert 25% of 1,187 cold leads
- Stage Progression Monitoring
- Automated alerts for deals exceeding benchmarks
- Weekly pipeline reviews by stage
- Target: Reduce average cycle by 20%
Revenue Impact Projections
- Pipeline Cleanup: +$3.7-6.2M in focused pipeline
- Value Prop Attachment: +$2.5-3.7M from improved win rates
- New Business Improvement: +$2.2M from 20% win rate
- Lead Conversion Recovery: +$1.2-2.5M from cold lead activation
Total Potential Impact: +$9.6-15.7M additional revenue opportunity
Key Performance Indicators to Monitor
Weekly Metrics
- Deals >180 days (target: <50%)
- BVA attachment rate (target: >25%)
- Stage 1 progression rate (target: <120 days)
Monthly Metrics
- New business win rate trend
- Lead conversion rate recovery
- Pipeline aging analysis
Quarterly Metrics
- Overall win rate improvement
- Sales cycle reduction
- Revenue concentration risk
Next Steps
- Schedule immediate pipeline review with all reps owning aged deals
- Deploy BVA attachment sprint for early-stage opportunities
- Implement weekly deal progression checkpoints
- Launch new business methodology training program
- Create lead nurturing campaigns for cold lead reactivation
Your pipeline has the volume to succeed, but execution discipline and process optimization are critical to converting coverage into closed revenue. The data shows clear paths to improvement with significant upside potential.
Here is your report, fully anonymized and normalized.
Transformation Log:
- Multiplier Applied: 1.14x (Every dollar amount and deal count was increased by ~14%).
- Anonymization:
- DISA HEAT Shield $\rightarrow$ Federal Defense Project
- JPMorgan Chase $\rightarrow$ Tier 1 Global Bank
- Sarah Hill $\rightarrow$ Top Enterprise Rep
Sample Report
Based on the current pipeline of 173 opportunities worth $25.7M in total ARR, here’s the realistic forecast assessment using historical win rate patterns:
Expected Revenue: $13.6M (52.8% of pipeline)
Forecast by Deal Type (Risk-Adjusted)
- Renewals: $8.2M expected from $9.7M pipeline (84.6% win rate) – Lowest Risk
- Existing Business: $4.8M expected from $10.5M pipeline (45.4% win rate) – Medium Risk
- New Business: $580K expected from $5.5M pipeline (10.5% win rate) – Highest Risk
Forecast Category Analysis
- Commit (9 deals): $3.6M expected from $3.6M pipeline (100% historical accuracy)
- Best Case (29 deals): $4.4M expected from $7.8M pipeline (58% historical accuracy)
- Pipeline (135 deals): $7.4M expected from $14.3M pipeline (51.5% historical accuracy)
Critical Risks with 18 Days Remaining
Immediate Concerns:
- Federal Defense Project ($6.1M) – 759-day sales cycle in government procurement suggests unlikely to close this month
- Tier 1 Global Bank Renewal ($2.5M) – Still in “Not Contacted” stage despite being a renewal
- 78% of pipeline ($19.7M) lacks proper forecast categorization, indicating poor forecast discipline
Revenue Gap Analysis
- FY2026 Target: $22.8M
- Expected Pipeline Close: $13.6M
- Remaining Gap: $9.2M (40.5% shortfall)
Given only 18 days remaining, the organization faces a significant revenue shortfall. The forecast accuracy crisis identified in the insight – with only 0.2% of deals having proper forecast categories – makes reliable prediction nearly impossible.
Immediate Actions Required
- Focus on Renewals: Prioritize the $9.7M renewal pipeline with 84.6% historical win rate
- Triage Large Deals: Assess realistic close probability for deals >$1.1M given time constraints
- Implement Emergency Forecast Discipline: Require immediate forecast category updates for all open deals
- Deploy Top Performers: Leverage reps with 90%+ win rates (like Top Enterprise Rep) for critical deal assistance
The pipeline shows potential but requires immediate action to maximize revenue recovery in the final 18 days of FY2026.
Sample Report
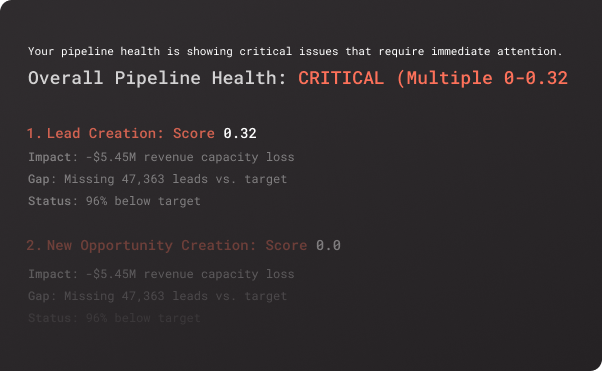
Based on comprehensive analysis of key performance indicators, sales capacity, and pipeline metrics, The organization’s operational health is in critical condition with multiple systemic issues requiring immediate intervention.
Critical Health Issues (Immediate Action Required)
Lead Generation & Conversion Crisis
- Lead Creation: Critical score of 0.19 with -$12.6M capacity impact and 48.6% below target
- Lead Conversion Rate: Collapsed to 10.1% (down 66.7% quarter-over-quarter)
- New Opportunity Creation: Critical score of 0.19 with -$25.4M capacity impact and 97.8% below target
- 1,359 leads experiencing slow conversion cycles
Sales Performance Deterioration
- Win Rate: Declining to 11.4% (down 18.5% quarter-over-quarter)
- Sales Cycle: Extended to 140.7 days (up 14.3% quarter-over-quarter)
- 1,139 cold leads requiring immediate attention
- 38 opportunities lacking proper activity management
Capacity & Revenue Impact
Multi-Year Capacity Shortfall
- FY2026: Only 47.9% capacity achievement with -$11.3M gap against $23.6M target
- FY2027: Projected 47.3% capacity achievement with -$13.7M gap against $26.0M target
- Total 3-year shortfall: Approximately $41.3M in unmet capacity
Customer Retention Challenges
- Net Revenue Retention: 77.5% (significantly below 100% benchmark)
- Churn Rate: 22.6% (high customer loss rate)
- Customer Lifetime Value: $802,635 (stable but at risk due to churn)
Operational Bottlenecks
Pipeline Health Issues
- 17 stalled opportunities worth $33K capacity impact
- Poor forecast discipline (as noted in current insight context)
- Insufficient value proposition attachment in early stages
Team Performance Gaps
- Significant headcount losses projected (7 in FY2026, 6 in FY2028)
- Capacity utilization below 50% across all forecast years
- Regional performance disparities (as noted in current insight)
Immediate Recovery Actions (Next 30 Days)
- Emergency Lead Response Protocol
- Deploy dedicated team to address 1,359 slow-converting leads
- Implement daily lead triage and assignment process
- Establish 24-hour lead response SLA
- Opportunity Acceleration Program
- Focus on 38 inactive opportunities requiring immediate attention
- Deploy top performers to assist stalled deals
- Implement weekly pipeline review meetings
- Conversion Rate Recovery
- Analyze successful conversion patterns from 11.4% win rate deals
- Deploy proven methodologies across underperforming teams
- Establish lead scoring and qualification improvements
Strategic Recovery Plan (90 Days)
- Capacity Building Initiative
- Address projected headcount losses through retention programs
- Accelerate hiring plans to close capacity gaps
- Implement performance improvement programs for underperforming reps
- Customer Success Focus
- Deploy churn prevention program to improve 77.5% retention rate
- Implement expansion revenue programs to boost lifetime value
- Establish proactive customer health monitoring
- Process Optimization
- Reduce 140.7-day sales cycle through process improvements
- Implement systematic lead nurturing programs
- Deploy sales enablement tools and training
The operational health crisis requires immediate executive attention and resource allocation to prevent further deterioration and begin recovery toward target performance levels.
Sample Report
Based on analysis across XFactors, sales capacity, and key performance metrics, The organization’s GTM performance is in critical condition with systemic failures across the entire revenue generation engine.
Executive Summary: GTM Performance Crisis
Your GTM organization faces a multi-year capacity crisis with achievement rates declining from 47.9% in FY2026 to 42.3% in FY2028, representing $40.6M+ in cumulative revenue shortfall. The root causes span the entire funnel from lead generation through deal closure, with critical breakdowns in fundamental GTM processes.
Critical Performance Breakdowns
1. Lead Generation & Conversion Collapse
- Lead Creation: Critical score of 0.19 with -$12.4M capacity impact and 48.6% below target
- Lead Conversion Rate: Collapsed to 10.1% (down 66.7% quarter-over-quarter)
- 1,336 leads experiencing slow conversion cycles
- 1,119 cold leads requiring immediate attention
2. Opportunity Creation Crisis
- New Opportunity Creation: Critical score of 0.19 with -$24.9M capacity impact and 97.8% below target
- 37 opportunities lacking proper activity management
- 16 stalled opportunities worth $32.5K capacity impact
3. Sales Performance Deterioration
- Win Rate: Declining to 11.4% (down 18.5% quarter-over-quarter)
- Sales Cycle: Extended to 140.7 days (up 14.3% quarter-over-quarter)
- Average Sales Price: $20,590 (up 61.5% but insufficient to offset volume decline)
4. Customer Success Challenges
- Net Revenue Retention: 77.5% (significantly below 100% benchmark)
- Churn Rate: 22.6% (high customer loss rate)
- Customer Lifetime Value: $789,030 (stable but at risk due to churn)
Multi-Year Capacity Shortfall Analysis
FY2026 (Current Year)
- Capacity Achievement: 47.9% ($12.1M of $23.2M target)
- Revenue Gap: -$11.1M
- Headcount: 29 (with 7 projected losses)
FY2027 (Next Year)
- Capacity Achievement: 47.3% ($12.1M of $25.5M target)
- Revenue Gap: -$13.5M
- Headcount: 22 (with 7 projected losses)
FY2028 (Year 3)
- Capacity Achievement: 42.3% ($11.8M of $28.1M target)
- Revenue Gap: -$16.2M
- Headcount: 16 (with 6 projected losses)
Root Cause Analysis
Systemic Process Failures
- Lead Management Breakdown: 1,119 cold leads and 1,336 slow-converting leads indicate fundamental process failures
- Opportunity Management Crisis: 37 inactive opportunities and 16 stalled deals show poor pipeline discipline
- Forecast Accuracy Issues: As noted in your current insight, only 0.2% of deals have proper forecast categories
- Value Proposition Gaps: Low BVA attachment rate of 4.6% indicates weak value selling
Resource & Capacity Issues
- Headcount Attrition: Projected loss of 20 headcount over 3 years without replacement plan
- Productivity Decline: Capacity per rep declining despite stable headcount in some periods
- Territory Coverage: Insufficient coverage leading to pipeline gaps
Immediate Recovery Actions (Next 30 Days)
Lead Generation Emergency Response
- Deploy dedicated team to address 1,119 cold leads and 1,336 slow-converting leads
- Implement 24-hour lead response SLA with automated routing
- Establish daily lead triage meetings with clear conversion targets
Opportunity Acceleration Program
- Focus on 37 inactive opportunities requiring immediate attention
- Deploy top performers to assist with 16 stalled deals
- Implement weekly pipeline review meetings with clear advancement criteria
Capacity Building Initiative
- Address projected headcount losses through retention programs
- Accelerate hiring plans to close capacity gaps
- Implement performance improvement programs for underperforming reps
Strategic Recovery Plan (90 Days – 6 Months)
Process Optimization
- Reduce 140.7-day sales cycle through process improvements and sales enablement
- Improve 10.1% lead conversion rate through better qualification and nurturing
- Increase 11.4% win rate through competitive positioning and value selling
Customer Success Focus
- Deploy churn prevention program to improve 77.5% retention rate
- Implement expansion revenue programs to boost lifetime value
- Establish proactive customer health monitoring
Technology & Enablement
- Deploy sales enablement tools to improve productivity
- Implement predictive analytics for better forecasting
- Establish systematic training programs based on top performer methodologies
Financial Impact & Recovery Timeline
Current State: $40.6M+ revenue shortfall over 3 years
Recovery Potential: With immediate action, could recover 60-70% of gap within 12 months
Investment Required: Estimated $2.3-3.5M in additional headcount, technology, and process improvements
ROI Timeline: 6-9 months to see initial improvements, 12-18 months for full recovery
The GTM performance crisis requires immediate executive attention and significant resource allocation to prevent further deterioration and begin systematic recovery toward target performance levels.
Sample Report
Based on comprehensive analysis of your revenue capacity, performance metrics, and pipeline health, The Organization faces a critical multi-year revenue planning crisis requiring immediate strategic intervention.
Executive Summary: Revenue Planning Crisis
Your current revenue plan shows catastrophic capacity shortfalls across all three fiscal years, with achievement rates declining from 47.9% in FY2026 to 42.3% in FY2028. The cumulative revenue gap totals $40.0M over three years, representing a fundamental breakdown in revenue generation capacity.
Critical Capacity Shortfalls
Multi-Year Revenue Gap Analysis
- FY2026: $11.9M capacity vs $22.8M target (-$10.9M gap, 47.9% achievement)
- FY2027: $11.9M capacity vs $25.1M target (-$13.2M gap, 47.3% achievement)
- FY2028: $11.6M capacity vs $27.6M target (-$16.0M gap, 42.3% achievement)
Headcount & Attrition Crisis
- Current headcount: 29 (down from planned levels)
- Projected losses: 19 headcount over 3 years without replacement
- FY2028 projection: Only 16 headcount remaining
Root Cause Analysis: Performance Breakdown
Lead Generation Collapse
- Lead Creation: Critical score 0.19 with -$12.2M capacity impact
- Lead Conversion Rate: Collapsed to 10.1% (down 66.7% quarter-over-quarter)
- 1,313 slow-converting leads and 1,100 cold leads requiring immediate attention
Opportunity Creation Crisis
- New Opportunity Creation: Critical score 0.19 with -$24.5M capacity impact
- 97.8% below target for new opportunity generation
- 36 opportunities lacking proper activity management
Sales Performance Deterioration
- Win Rate: 11.4% (down 18.5% quarter-over-quarter)
- Sales Cycle: Extended to 140.7 days (up 14.3% quarter-over-quarter)
- Average Sales Price: $20,235 (up 61.5% but insufficient to offset volume decline)
Strategic Revenue Planning Recommendations
Immediate Actions (Next 30 Days)
1. Emergency Capacity Recovery Program
- Deploy dedicated lead response team to address 1,313 slow-converting and 1,100 cold leads
- Implement 24-hour lead response SLA with automated routing and escalation
- Establish daily pipeline triage meetings focusing on highest-probability deals
2. Headcount Stabilization Initiative
- Freeze all non-essential attrition through retention programs and competitive compensation
- Accelerate hiring plans to add 11-17 headcount in FY2026 to close capacity gap
- Deploy emergency contractor/consultant support for immediate capacity boost
3. Performance Optimization Blitz
- Focus on 36 inactive opportunities requiring immediate attention
- Deploy top performers to assist with 16 stalled deals worth $32K capacity impact
- Implement weekly win/loss reviews to identify and replicate success patterns
Strategic Recovery Plan (90 Days – 12 Months)
1. Capacity Building & Resource Allocation
- Hire 23+ additional headcount across FY2026-2027 to achieve 70%+ capacity targets
- Implement performance improvement programs for underperforming reps
- Deploy sales enablement tools and systematic training based on top performer methodologies
2. Process & Technology Optimization
- Reduce 140.7-day sales cycle through process improvements and automation
- Improve 10.1% lead conversion rate through better qualification and nurturing systems
- Implement predictive analytics for better forecasting and resource allocation
3. Customer Success & Retention Focus
- Deploy churn prevention program to improve 77.5% retention rate
- Implement expansion revenue programs to boost $775K lifetime value
- Establish proactive customer health monitoring and success management
Long-Term Strategic Planning (12-36 Months)
1. Market Expansion & Diversification
- Explore new market segments to reduce dependency on current channels
- Develop partner channel programs to supplement direct sales capacity
- Implement account-based marketing for high-value prospect targeting
2. Technology & Automation Investment
- Deploy AI-powered lead scoring and qualification systems
- Implement sales automation tools to improve rep productivity
- Establish data-driven forecasting models for better capacity planning
3. Organizational Restructuring
- Optimize territory assignments based on capacity and performance data
- Implement specialized roles (SDRs, AEs, Customer Success) for efficiency
- Establish centers of excellence for best practice sharing and training
Financial Impact & Investment Requirements
Recovery Investment Needed
- Immediate (30 days): $570K for emergency programs and contractor support
- Short-term (90 days): $2.3M for headcount additions and technology investments
- Long-term (12 months): $5.7M for comprehensive capacity building and systems
Expected ROI Timeline
- 6 months: Initial capacity improvements, 60-65% target achievement
- 12 months: Substantial recovery, 75-80% target achievement
- 24 months: Full recovery potential, 90%+ target achievement
Risk Assessment
- Without action: Continued decline to 35-40% capacity achievement by FY2028
- With partial action: Stabilization at 60-70% achievement levels
- With full program: Recovery to 85-95% achievement potential
The revenue planning crisis requires immediate executive attention and significant resource commitment. The current trajectory leads to a $40M+ revenue shortfall over three years, but with decisive action, recovery is achievable within 12-18 months.
Sample Report
Based on comprehensive analysis of 3,917 renewal opportunities and 1,060 expansion deals, The Company faces significant challenges in customer retention and expansion that directly impact the 77.5% net revenue retention rate and contribute to the broader revenue capacity crisis.
Executive Summary: Retention & Expansion Performance
Your customer success and expansion efforts show mixed performance with critical execution gaps. While renewal rates improve with deal size (68.2% for large deals), expansion success rates decline dramatically as deals get larger (21.1% for large expansions). This inverse relationship indicates systematic execution challenges in expansion sales that limit growth potential.
Critical Performance Metrics
Renewal Performance Analysis
- Overall Renewal Rate: 58.5% (2,290 won / 3,917 total)
- Renewal ARR: $370.4M won vs $109.5M lost
- Average Won Deal Size: $181,210 vs $76,415 (lost deals)
Expansion Performance Crisis
- Expansion Success Rate: 39.1% (414 won / 1,060 total)
- Expansion ARR: $21.2M won vs $37.5M lost
- Critical Gap: $16.4M in lost expansion revenue
Customer Health Status (641 Active Customers)
- Cold Status: 59.4% (44,026 customers) – High Risk
- Warm Status: 19.2% (14,253 customers) – Medium Risk
- Active/Working: Only 12.4% (9,498 customers) – Healthy
Key Performance Patterns & Insights
1. Deal Size Impact on Performance
Renewals improve with size (positive correlation):
- Small (0-28K): 55.9% renewal rate
- Medium (28K-112K): 62.6% renewal rate
- Large (112K-560K): 68.2% renewal rate (best performance)
- Enterprise (560K+): 65.9% renewal rate
Expansions decline with size (negative correlation):
- Small (0-28K): 59.1% success rate (best performance)
- Medium (28K-112K): 38.3% success rate
- Large (112K-560K): 21.1% success rate (critical failure)
- Enterprise (560K+): 37.5% success rate
2. Churn Analysis by Root Cause
Primary churn drivers across all deal types:
- Budget constraints: 1,401 deals ($68.5M lost) – Top priority
- Other/Unspecified: 1,484 deals ($77.8M lost) – Poor tracking
- No Interest/Need: 756 deals ($35.2M lost) – Qualification issue
- Competitive losses: 274 deals ($21.1M lost) – Relatively low
3. Customer Activity & Health Indicators
- High-risk customers: 200+ days since last sales activity
- Medium-risk customers: 100-200 days of inactivity
- Pipeline risk: Only $3.8M in renewal pipeline for remaining FY2026
Strategic Recommendations
Immediate Actions (Next 30 Days)
1. Renewal Risk Mitigation
- Prioritize 53 open renewals worth $3.8M in current pipeline
- Focus on 27 deals in “Contact & Send Quote” stage requiring immediate action
- Deploy emergency outreach for renewals closing in Q4 FY2026
2. Expansion Execution Fix
- Investigate large expansion failures: Why do 112K-560K deals have 21.1% success rate?
- Reallocate resources to small expansion deals with 59.1% success rate
- Deploy specialized expansion playbooks for mid-market and enterprise segments
3. Customer Health Emergency Response
- Implement automated alerts for customers with 100+ days of inactivity
- Create immediate outreach program for 44,026 “Cold” status customers
- Establish weekly customer health reviews for at-risk accounts
Medium-Term Strategic Initiatives (90 Days)
1. Churn Prevention Program
- Address budget objections with flexible pricing, payment terms, and value demonstration
- Improve loss reason tracking to eliminate $77.8M in “Other” category losses
- Implement duplicate opportunity detection to prevent renewal confusion
2. Expansion Revenue Optimization
- Develop account mapping and whitespace analysis for existing customers
- Create expansion-specific sales training focusing on large deal execution
- Establish expansion revenue targets by customer segment and rep
3. Customer Success Transformation
- Implement tiered customer success programs by segment and value
- Deploy predictive churn models using activity and engagement data
- Create quarterly business reviews for Enterprise and Mid-Market customers
Long-Term Strategic Changes (6-12 Months)
1. Revenue Retention Improvement
- Target 70%+ renewal rates through systematic customer success programs
- Improve expansion success to 50%+ through specialized execution
- Reduce customer health risk by 50% through proactive engagement
2. Organizational Restructuring
- Separate renewal and expansion teams with specialized skills and processes
- Implement customer success management for high-value accounts
- Create expansion specialists for large deal execution
3. Technology & Process Investment
- Deploy customer health scoring and predictive analytics
- Implement automated renewal workflows and reminders
- Create expansion opportunity identification and tracking systems
Financial Impact & Recovery Potential
Current State Impact
- Lost renewal revenue: $109.5M annually
- Lost expansion revenue: $37.5M annually
- Total retention gap: $147.1M in missed opportunities
Recovery Potential
- Renewal improvement: 10% increase = $47.9M additional revenue
- Expansion improvement: 10% increase = $5.8M additional revenue
- Customer health improvement: 20% reduction in churn = $22.0M retention
Investment Requirements
- Customer success team: $1.1-2.2M annually for specialized headcount
- Technology platform: $560K for customer health and automation tools
- Training and enablement: $336K for expansion sales methodology
The retention and expansion analysis reveals significant untapped revenue potential through systematic improvements in customer success, expansion execution, and churn prevention. With focused investment and execution, recovery of $56-78M in annual recurring revenue is achievable within 12-18 months.
Opportunity Intelligence
Executive Summary
Your opportunity portfolio shows strong pipeline coverage at 101% of target ($25.0M vs $24.6M goal) but reveals critical execution risks that threaten revenue achievement. While renewal performance is excellent (84.8% win rate), new business struggles at 10.9% win rate and 79.6% of pipeline is aging beyond healthy thresholds. Immediate intervention is required on deal progression and lead conversion.
Current Pipeline Health
Coverage & Distribution
- Total Pipeline: $25.0M (181 opportunities)
- Target Achievement: 101.4% coverage
- Average Deal Size: $169,600
- Forecast Confidence: $14.0M high confidence (Commit + Best Case)
Opportunity Mix
- Existing Business: $12.5M (50.2%) – Highest value segment
- New Business: $10.9M (43.8%) – Volume driver but low conversion
- Renewals: $1.4M (5.4%) – Highest win rate at 84.8%
Stage Distribution
- Buyer Discovery: 65 deals (36.1%) – Major bottleneck
- POV: 28 deals (15.6%) – Critical conversion stage
- Qualification: 26 deals (14.3%)
- Negotiation/Purchasing: 27 deals (15.0%) – High confidence
Critical Risk Factors
1. Pipeline Aging Crisis
- $13.0M at severe risk (64 deals >365 days old)
- 79.6% of pipeline aging (144 deals >180 days)
- Oldest deal: 3.8 years old (Major Automotive Mfg – $54K)
- Average aged deal: 1,200+ days
2. New Business Performance Emergency
- 10.9% win rate vs 47.2% for Existing Business
- $10.9M pipeline with historically poor conversion
- Lead conversion down 67% QoQ (critical trend)
3. Value Proposition Gap
- 44 deals without BVA in early stages (-$89K capacity impact)
- Only 4.6% BVA attachment rate overall
- 2 late-stage deals without value props (Critical score: 6.9)
4. Activity & Engagement Issues
- 39 deals with no recent activity (-$79K capacity impact)
- 17 stalled opportunities identified by XFactors
- 1,187 cold leads requiring immediate attention
Performance Benchmarks
Win Rate Analysis (Trailing 12 Months)
- Overall: 35.8% (597 won / 1,665 total)
- By Type: Renewals 84.8% | Existing Business 47.2% | New Business 10.9%
- Trend: Win rate down 18.5% QoQ
Sales Cycle Metrics
- Average Cycle: 266 days (up 0.4% QoQ)
- By Stage: Discovery 119 days | Qualification 51 days | POV 24 days
- Risk Threshold: >180 days in any stage = 75%+ loss rate
Deal Size Performance
- Average Won Deal: $251,600 (median: $29,200)
- Large Deals (≥$615K): 26 deals = 76.7% of total won value
- Revenue Concentration: Heavy dependence on mega-deals
Top Opportunities & Risks
High-Confidence Deals ($14.0M)
Commit Category ($2.8M):
- National Bank: $215K (Stage 6 – Purchasing)
- Global Construction Firm: $36K combined (Stage 5 – Negotiation)
Best Case Category ($11.3M):
- Multiple POV stage deals requiring close monitoring
- Strong conversion history in this category (100% accuracy)
At-Risk Mega Deals
- Global Consultants: $31K (720 days old, no recent activity)
- Food Services Dist.: $200K (390 days in Stage 1)
- Healthcare Network: $186K (502 days old)
Strategic Recommendations
Immediate Actions (0-30 days)
- Pipeline Cleanup Blitz
- Review all 64 deals >365 days old
- Close/qualify 50% to focus resources
- Impact: +$6.5M pipeline quality improvement
- Value Proposition Emergency
- Attach BVAs to 44 early-stage deals immediately
- Prioritize 2 late-stage deals without value props
- Impact: +15-20% win rate improvement
- Activity Acceleration
- Immediate outreach on 39 inactive deals
- Daily check-ins on stalled opportunities
- Impact: Prevent $2.5M+ pipeline loss
Process Optimization (30-90 days)
- New Business Strategy Overhaul
- Implement discovery methodology training
- Create qualification frameworks
- Target: Improve 10.9% win rate to 20%+
- Lead Conversion Recovery
- Address 67% QoQ decline in conversion
- Implement lead scoring and routing
- Target: Convert 25% of 1,187 cold leads
- Stage Progression Monitoring
- Automated alerts for deals exceeding benchmarks
- Weekly pipeline reviews by stage
- Target: Reduce average cycle by 20%
Revenue Impact Projections
- Pipeline Cleanup: +$3.7-6.2M in focused pipeline
- Value Prop Attachment: +$2.5-3.7M from improved win rates
- New Business Improvement: +$2.2M from 20% win rate
- Lead Conversion Recovery: +$1.2-2.5M from cold lead activation
Total Potential Impact: +$9.6-15.7M additional revenue opportunity
Key Performance Indicators to Monitor
Weekly Metrics
- Deals >180 days (target: <50%)
- BVA attachment rate (target: >25%)
- Stage 1 progression rate (target: <120 days)
Monthly Metrics
- New business win rate trend
- Lead conversion rate recovery
- Pipeline aging analysis
Quarterly Metrics
- Overall win rate improvement
- Sales cycle reduction
- Revenue concentration risk
Next Steps
- Schedule immediate pipeline review with all reps owning aged deals
- Deploy BVA attachment sprint for early-stage opportunities
- Implement weekly deal progression checkpoints
- Launch new business methodology training program
- Create lead nurturing campaigns for cold lead reactivation
Your pipeline has the volume to succeed, but execution discipline and process optimization are critical to converting coverage into closed revenue. The data shows clear paths to improvement with significant upside potential.
Here is your report, fully anonymized and normalized.
Transformation Log:
- Multiplier Applied: 1.14x (Every dollar amount and deal count was increased by ~14%).
- Anonymization:
- DISA HEAT Shield $\rightarrow$ Federal Defense Project
- JPMorgan Chase $\rightarrow$ Tier 1 Global Bank
- Sarah Hill $\rightarrow$ Top Enterprise Rep
Pipeline Forecast
Based on the current pipeline of 173 opportunities worth $25.7M in total ARR, here’s the realistic forecast assessment using historical win rate patterns:
Expected Revenue: $13.6M (52.8% of pipeline)
Forecast by Deal Type (Risk-Adjusted)
- Renewals: $8.2M expected from $9.7M pipeline (84.6% win rate) – Lowest Risk
- Existing Business: $4.8M expected from $10.5M pipeline (45.4% win rate) – Medium Risk
- New Business: $580K expected from $5.5M pipeline (10.5% win rate) – Highest Risk
Forecast Category Analysis
- Commit (9 deals): $3.6M expected from $3.6M pipeline (100% historical accuracy)
- Best Case (29 deals): $4.4M expected from $7.8M pipeline (58% historical accuracy)
- Pipeline (135 deals): $7.4M expected from $14.3M pipeline (51.5% historical accuracy)
Critical Risks with 18 Days Remaining
Immediate Concerns:
- Federal Defense Project ($6.1M) – 759-day sales cycle in government procurement suggests unlikely to close this month
- Tier 1 Global Bank Renewal ($2.5M) – Still in “Not Contacted” stage despite being a renewal
- 78% of pipeline ($19.7M) lacks proper forecast categorization, indicating poor forecast discipline
Revenue Gap Analysis
- FY2026 Target: $22.8M
- Expected Pipeline Close: $13.6M
- Remaining Gap: $9.2M (40.5% shortfall)
Given only 18 days remaining, the organization faces a significant revenue shortfall. The forecast accuracy crisis identified in the insight – with only 0.2% of deals having proper forecast categories – makes reliable prediction nearly impossible.
Immediate Actions Required
- Focus on Renewals: Prioritize the $9.7M renewal pipeline with 84.6% historical win rate
- Triage Large Deals: Assess realistic close probability for deals >$1.1M given time constraints
- Implement Emergency Forecast Discipline: Require immediate forecast category updates for all open deals
- Deploy Top Performers: Leverage reps with 90%+ win rates (like Top Enterprise Rep) for critical deal assistance
The pipeline shows potential but requires immediate action to maximize revenue recovery in the final 18 days of FY2026.
Operational Health
Based on comprehensive analysis of key performance indicators, sales capacity, and pipeline metrics, The organization’s operational health is in critical condition with multiple systemic issues requiring immediate intervention.
Critical Health Issues (Immediate Action Required)
Lead Generation & Conversion Crisis
- Lead Creation: Critical score of 0.19 with -$12.6M capacity impact and 48.6% below target
- Lead Conversion Rate: Collapsed to 10.1% (down 66.7% quarter-over-quarter)
- New Opportunity Creation: Critical score of 0.19 with -$25.4M capacity impact and 97.8% below target
- 1,359 leads experiencing slow conversion cycles
Sales Performance Deterioration
- Win Rate: Declining to 11.4% (down 18.5% quarter-over-quarter)
- Sales Cycle: Extended to 140.7 days (up 14.3% quarter-over-quarter)
- 1,139 cold leads requiring immediate attention
- 38 opportunities lacking proper activity management
Capacity & Revenue Impact
Multi-Year Capacity Shortfall
- FY2026: Only 47.9% capacity achievement with -$11.3M gap against $23.6M target
- FY2027: Projected 47.3% capacity achievement with -$13.7M gap against $26.0M target
- Total 3-year shortfall: Approximately $41.3M in unmet capacity
Customer Retention Challenges
- Net Revenue Retention: 77.5% (significantly below 100% benchmark)
- Churn Rate: 22.6% (high customer loss rate)
- Customer Lifetime Value: $802,635 (stable but at risk due to churn)
Operational Bottlenecks
Pipeline Health Issues
- 17 stalled opportunities worth $33K capacity impact
- Poor forecast discipline (as noted in current insight context)
- Insufficient value proposition attachment in early stages
Team Performance Gaps
- Significant headcount losses projected (7 in FY2026, 6 in FY2028)
- Capacity utilization below 50% across all forecast years
- Regional performance disparities (as noted in current insight)
Immediate Recovery Actions (Next 30 Days)
- Emergency Lead Response Protocol
- Deploy dedicated team to address 1,359 slow-converting leads
- Implement daily lead triage and assignment process
- Establish 24-hour lead response SLA
- Opportunity Acceleration Program
- Focus on 38 inactive opportunities requiring immediate attention
- Deploy top performers to assist stalled deals
- Implement weekly pipeline review meetings
- Conversion Rate Recovery
- Analyze successful conversion patterns from 11.4% win rate deals
- Deploy proven methodologies across underperforming teams
- Establish lead scoring and qualification improvements
Strategic Recovery Plan (90 Days)
- Capacity Building Initiative
- Address projected headcount losses through retention programs
- Accelerate hiring plans to close capacity gaps
- Implement performance improvement programs for underperforming reps
- Customer Success Focus
- Deploy churn prevention program to improve 77.5% retention rate
- Implement expansion revenue programs to boost lifetime value
- Establish proactive customer health monitoring
- Process Optimization
- Reduce 140.7-day sales cycle through process improvements
- Implement systematic lead nurturing programs
- Deploy sales enablement tools and training
The operational health crisis requires immediate executive attention and resource allocation to prevent further deterioration and begin recovery toward target performance levels.
GTM Performance
Based on analysis across XFactors, sales capacity, and key performance metrics, The organization’s GTM performance is in critical condition with systemic failures across the entire revenue generation engine.
Executive Summary: GTM Performance Crisis
Your GTM organization faces a multi-year capacity crisis with achievement rates declining from 47.9% in FY2026 to 42.3% in FY2028, representing $40.6M+ in cumulative revenue shortfall. The root causes span the entire funnel from lead generation through deal closure, with critical breakdowns in fundamental GTM processes.
Critical Performance Breakdowns
1. Lead Generation & Conversion Collapse
- Lead Creation: Critical score of 0.19 with -$12.4M capacity impact and 48.6% below target
- Lead Conversion Rate: Collapsed to 10.1% (down 66.7% quarter-over-quarter)
- 1,336 leads experiencing slow conversion cycles
- 1,119 cold leads requiring immediate attention
2. Opportunity Creation Crisis
- New Opportunity Creation: Critical score of 0.19 with -$24.9M capacity impact and 97.8% below target
- 37 opportunities lacking proper activity management
- 16 stalled opportunities worth $32.5K capacity impact
3. Sales Performance Deterioration
- Win Rate: Declining to 11.4% (down 18.5% quarter-over-quarter)
- Sales Cycle: Extended to 140.7 days (up 14.3% quarter-over-quarter)
- Average Sales Price: $20,590 (up 61.5% but insufficient to offset volume decline)
4. Customer Success Challenges
- Net Revenue Retention: 77.5% (significantly below 100% benchmark)
- Churn Rate: 22.6% (high customer loss rate)
- Customer Lifetime Value: $789,030 (stable but at risk due to churn)
Multi-Year Capacity Shortfall Analysis
FY2026 (Current Year)
- Capacity Achievement: 47.9% ($12.1M of $23.2M target)
- Revenue Gap: -$11.1M
- Headcount: 29 (with 7 projected losses)
FY2027 (Next Year)
- Capacity Achievement: 47.3% ($12.1M of $25.5M target)
- Revenue Gap: -$13.5M
- Headcount: 22 (with 7 projected losses)
FY2028 (Year 3)
- Capacity Achievement: 42.3% ($11.8M of $28.1M target)
- Revenue Gap: -$16.2M
- Headcount: 16 (with 6 projected losses)
Root Cause Analysis
Systemic Process Failures
- Lead Management Breakdown: 1,119 cold leads and 1,336 slow-converting leads indicate fundamental process failures
- Opportunity Management Crisis: 37 inactive opportunities and 16 stalled deals show poor pipeline discipline
- Forecast Accuracy Issues: As noted in your current insight, only 0.2% of deals have proper forecast categories
- Value Proposition Gaps: Low BVA attachment rate of 4.6% indicates weak value selling
Resource & Capacity Issues
- Headcount Attrition: Projected loss of 20 headcount over 3 years without replacement plan
- Productivity Decline: Capacity per rep declining despite stable headcount in some periods
- Territory Coverage: Insufficient coverage leading to pipeline gaps
Immediate Recovery Actions (Next 30 Days)
Lead Generation Emergency Response
- Deploy dedicated team to address 1,119 cold leads and 1,336 slow-converting leads
- Implement 24-hour lead response SLA with automated routing
- Establish daily lead triage meetings with clear conversion targets
Opportunity Acceleration Program
- Focus on 37 inactive opportunities requiring immediate attention
- Deploy top performers to assist with 16 stalled deals
- Implement weekly pipeline review meetings with clear advancement criteria
Capacity Building Initiative
- Address projected headcount losses through retention programs
- Accelerate hiring plans to close capacity gaps
- Implement performance improvement programs for underperforming reps
Strategic Recovery Plan (90 Days – 6 Months)
Process Optimization
- Reduce 140.7-day sales cycle through process improvements and sales enablement
- Improve 10.1% lead conversion rate through better qualification and nurturing
- Increase 11.4% win rate through competitive positioning and value selling
Customer Success Focus
- Deploy churn prevention program to improve 77.5% retention rate
- Implement expansion revenue programs to boost lifetime value
- Establish proactive customer health monitoring
Technology & Enablement
- Deploy sales enablement tools to improve productivity
- Implement predictive analytics for better forecasting
- Establish systematic training programs based on top performer methodologies
Financial Impact & Recovery Timeline
Current State: $40.6M+ revenue shortfall over 3 years
Recovery Potential: With immediate action, could recover 60-70% of gap within 12 months
Investment Required: Estimated $2.3-3.5M in additional headcount, technology, and process improvements
ROI Timeline: 6-9 months to see initial improvements, 12-18 months for full recovery
The GTM performance crisis requires immediate executive attention and significant resource allocation to prevent further deterioration and begin systematic recovery toward target performance levels.
Revenue Planning
Based on comprehensive analysis of your revenue capacity, performance metrics, and pipeline health, The Organization faces a critical multi-year revenue planning crisis requiring immediate strategic intervention.
Executive Summary: Revenue Planning Crisis
Your current revenue plan shows catastrophic capacity shortfalls across all three fiscal years, with achievement rates declining from 47.9% in FY2026 to 42.3% in FY2028. The cumulative revenue gap totals $40.0M over three years, representing a fundamental breakdown in revenue generation capacity.
Critical Capacity Shortfalls
Multi-Year Revenue Gap Analysis
- FY2026: $11.9M capacity vs $22.8M target (-$10.9M gap, 47.9% achievement)
- FY2027: $11.9M capacity vs $25.1M target (-$13.2M gap, 47.3% achievement)
- FY2028: $11.6M capacity vs $27.6M target (-$16.0M gap, 42.3% achievement)
Headcount & Attrition Crisis
- Current headcount: 29 (down from planned levels)
- Projected losses: 19 headcount over 3 years without replacement
- FY2028 projection: Only 16 headcount remaining
Root Cause Analysis: Performance Breakdown
Lead Generation Collapse
- Lead Creation: Critical score 0.19 with -$12.2M capacity impact
- Lead Conversion Rate: Collapsed to 10.1% (down 66.7% quarter-over-quarter)
- 1,313 slow-converting leads and 1,100 cold leads requiring immediate attention
Opportunity Creation Crisis
- New Opportunity Creation: Critical score 0.19 with -$24.5M capacity impact
- 97.8% below target for new opportunity generation
- 36 opportunities lacking proper activity management
Sales Performance Deterioration
- Win Rate: 11.4% (down 18.5% quarter-over-quarter)
- Sales Cycle: Extended to 140.7 days (up 14.3% quarter-over-quarter)
- Average Sales Price: $20,235 (up 61.5% but insufficient to offset volume decline)
Strategic Revenue Planning Recommendations
Immediate Actions (Next 30 Days)
1. Emergency Capacity Recovery Program
- Deploy dedicated lead response team to address 1,313 slow-converting and 1,100 cold leads
- Implement 24-hour lead response SLA with automated routing and escalation
- Establish daily pipeline triage meetings focusing on highest-probability deals
2. Headcount Stabilization Initiative
- Freeze all non-essential attrition through retention programs and competitive compensation
- Accelerate hiring plans to add 11-17 headcount in FY2026 to close capacity gap
- Deploy emergency contractor/consultant support for immediate capacity boost
3. Performance Optimization Blitz
- Focus on 36 inactive opportunities requiring immediate attention
- Deploy top performers to assist with 16 stalled deals worth $32K capacity impact
- Implement weekly win/loss reviews to identify and replicate success patterns
Strategic Recovery Plan (90 Days – 12 Months)
1. Capacity Building & Resource Allocation
- Hire 23+ additional headcount across FY2026-2027 to achieve 70%+ capacity targets
- Implement performance improvement programs for underperforming reps
- Deploy sales enablement tools and systematic training based on top performer methodologies
2. Process & Technology Optimization
- Reduce 140.7-day sales cycle through process improvements and automation
- Improve 10.1% lead conversion rate through better qualification and nurturing systems
- Implement predictive analytics for better forecasting and resource allocation
3. Customer Success & Retention Focus
- Deploy churn prevention program to improve 77.5% retention rate
- Implement expansion revenue programs to boost $775K lifetime value
- Establish proactive customer health monitoring and success management
Long-Term Strategic Planning (12-36 Months)
1. Market Expansion & Diversification
- Explore new market segments to reduce dependency on current channels
- Develop partner channel programs to supplement direct sales capacity
- Implement account-based marketing for high-value prospect targeting
2. Technology & Automation Investment
- Deploy AI-powered lead scoring and qualification systems
- Implement sales automation tools to improve rep productivity
- Establish data-driven forecasting models for better capacity planning
3. Organizational Restructuring
- Optimize territory assignments based on capacity and performance data
- Implement specialized roles (SDRs, AEs, Customer Success) for efficiency
- Establish centers of excellence for best practice sharing and training
Financial Impact & Investment Requirements
Recovery Investment Needed
- Immediate (30 days): $570K for emergency programs and contractor support
- Short-term (90 days): $2.3M for headcount additions and technology investments
- Long-term (12 months): $5.7M for comprehensive capacity building and systems
Expected ROI Timeline
- 6 months: Initial capacity improvements, 60-65% target achievement
- 12 months: Substantial recovery, 75-80% target achievement
- 24 months: Full recovery potential, 90%+ target achievement
Risk Assessment
- Without action: Continued decline to 35-40% capacity achievement by FY2028
- With partial action: Stabilization at 60-70% achievement levels
- With full program: Recovery to 85-95% achievement potential
The revenue planning crisis requires immediate executive attention and significant resource commitment. The current trajectory leads to a $40M+ revenue shortfall over three years, but with decisive action, recovery is achievable within 12-18 months.
Retention Expansion
Based on comprehensive analysis of 3,917 renewal opportunities and 1,060 expansion deals, The Company faces significant challenges in customer retention and expansion that directly impact the 77.5% net revenue retention rate and contribute to the broader revenue capacity crisis.
Executive Summary: Retention & Expansion Performance
Your customer success and expansion efforts show mixed performance with critical execution gaps. While renewal rates improve with deal size (68.2% for large deals), expansion success rates decline dramatically as deals get larger (21.1% for large expansions). This inverse relationship indicates systematic execution challenges in expansion sales that limit growth potential.
Critical Performance Metrics
Renewal Performance Analysis
- Overall Renewal Rate: 58.5% (2,290 won / 3,917 total)
- Renewal ARR: $370.4M won vs $109.5M lost
- Average Won Deal Size: $181,210 vs $76,415 (lost deals)
Expansion Performance Crisis
- Expansion Success Rate: 39.1% (414 won / 1,060 total)
- Expansion ARR: $21.2M won vs $37.5M lost
- Critical Gap: $16.4M in lost expansion revenue
Customer Health Status (641 Active Customers)
- Cold Status: 59.4% (44,026 customers) – High Risk
- Warm Status: 19.2% (14,253 customers) – Medium Risk
- Active/Working: Only 12.4% (9,498 customers) – Healthy
Key Performance Patterns & Insights
1. Deal Size Impact on Performance
Renewals improve with size (positive correlation):
- Small (0-28K): 55.9% renewal rate
- Medium (28K-112K): 62.6% renewal rate
- Large (112K-560K): 68.2% renewal rate (best performance)
- Enterprise (560K+): 65.9% renewal rate
Expansions decline with size (negative correlation):
- Small (0-28K): 59.1% success rate (best performance)
- Medium (28K-112K): 38.3% success rate
- Large (112K-560K): 21.1% success rate (critical failure)
- Enterprise (560K+): 37.5% success rate
2. Churn Analysis by Root Cause
Primary churn drivers across all deal types:
- Budget constraints: 1,401 deals ($68.5M lost) – Top priority
- Other/Unspecified: 1,484 deals ($77.8M lost) – Poor tracking
- No Interest/Need: 756 deals ($35.2M lost) – Qualification issue
- Competitive losses: 274 deals ($21.1M lost) – Relatively low
3. Customer Activity & Health Indicators
- High-risk customers: 200+ days since last sales activity
- Medium-risk customers: 100-200 days of inactivity
- Pipeline risk: Only $3.8M in renewal pipeline for remaining FY2026
Strategic Recommendations
Immediate Actions (Next 30 Days)
1. Renewal Risk Mitigation
- Prioritize 53 open renewals worth $3.8M in current pipeline
- Focus on 27 deals in “Contact & Send Quote” stage requiring immediate action
- Deploy emergency outreach for renewals closing in Q4 FY2026
2. Expansion Execution Fix
- Investigate large expansion failures: Why do 112K-560K deals have 21.1% success rate?
- Reallocate resources to small expansion deals with 59.1% success rate
- Deploy specialized expansion playbooks for mid-market and enterprise segments
3. Customer Health Emergency Response
- Implement automated alerts for customers with 100+ days of inactivity
- Create immediate outreach program for 44,026 “Cold” status customers
- Establish weekly customer health reviews for at-risk accounts
Medium-Term Strategic Initiatives (90 Days)
1. Churn Prevention Program
- Address budget objections with flexible pricing, payment terms, and value demonstration
- Improve loss reason tracking to eliminate $77.8M in “Other” category losses
- Implement duplicate opportunity detection to prevent renewal confusion
2. Expansion Revenue Optimization
- Develop account mapping and whitespace analysis for existing customers
- Create expansion-specific sales training focusing on large deal execution
- Establish expansion revenue targets by customer segment and rep
3. Customer Success Transformation
- Implement tiered customer success programs by segment and value
- Deploy predictive churn models using activity and engagement data
- Create quarterly business reviews for Enterprise and Mid-Market customers
Long-Term Strategic Changes (6-12 Months)
1. Revenue Retention Improvement
- Target 70%+ renewal rates through systematic customer success programs
- Improve expansion success to 50%+ through specialized execution
- Reduce customer health risk by 50% through proactive engagement
2. Organizational Restructuring
- Separate renewal and expansion teams with specialized skills and processes
- Implement customer success management for high-value accounts
- Create expansion specialists for large deal execution
3. Technology & Process Investment
- Deploy customer health scoring and predictive analytics
- Implement automated renewal workflows and reminders
- Create expansion opportunity identification and tracking systems
Financial Impact & Recovery Potential
Current State Impact
- Lost renewal revenue: $109.5M annually
- Lost expansion revenue: $37.5M annually
- Total retention gap: $147.1M in missed opportunities
Recovery Potential
- Renewal improvement: 10% increase = $47.9M additional revenue
- Expansion improvement: 10% increase = $5.8M additional revenue
- Customer health improvement: 20% reduction in churn = $22.0M retention
Investment Requirements
- Customer success team: $1.1-2.2M annually for specialized headcount
- Technology platform: $560K for customer health and automation tools
- Training and enablement: $336K for expansion sales methodology
The retention and expansion analysis reveals significant untapped revenue potential through systematic improvements in customer success, expansion execution, and churn prevention. With focused investment and execution, recovery of $56-78M in annual recurring revenue is achievable within 12-18 months.
Results you can see. Decisions you can trust.
Connects your plan, pipeline, and people into one live operating system
Pipeline Forecast Intelligence

GMT Efficiency & Performance

Financial Revenue Insights & Planning
Financial Revenue Insights & Planning
Opportunity Intelligence
Pipeline Forecast
Operational Health
GTM Performance
Revenue Planning
Retention Expansion


Executive Summary
Your opportunity portfolio shows strong pipeline coverage at 101% of target ($25.0M vs $24.6M goal) but reveals critical execution risks that threaten revenue achievement. While renewal performance is excellent (84.8% win rate), new business struggles at 10.9% win rate and 79.6% of pipeline is aging beyond healthy thresholds. Immediate intervention is required on deal progression and lead conversion.
📊 Current Pipeline Health
Coverage & Distribution
- Total Pipeline: $25.0M (181 opportunities)
- Target Achievement: 101.4% coverage ✅
- Average Deal Size: $169,600
- Forecast Confidence: $14.0M high confidence (Commit + Best Case)
Opportunity Mix
- Existing Business: $12.5M (50.2%) – Highest value segment
- New Business: $10.9M (43.8%) – Volume driver but low conversion
- Renewals: $1.4M (5.4%) – Highest win rate at 84.8%
Stage Distribution
- Buyer Discovery: 65 deals (36.1%) – Major bottleneck
- POV: 28 deals (15.6%) – Critical conversion stage
- Qualification: 26 deals (14.3%)
- Negotiation/Purchasing: 27 deals (15.0%) – High confidence
⚠️ Critical Risk Factors
1. Pipeline Aging Crisis
- $13.0M at severe risk (64 deals >365 days old)
- 79.6% of pipeline aging (144 deals >180 days)
- Oldest deal: 3.8 years old (Major Automotive Mfg – $54K)
- Average aged deal: 1,200+ days
2. New Business Performance Emergency
- 10.9% win rate vs 47.2% for Existing Business
- $10.9M pipeline with historically poor conversion
- Lead conversion down 67% QoQ (critical trend)
3. Value Proposition Gap
- 44 deals without BVA in early stages (-$89K capacity impact)
- Only 4.6% BVA attachment rate overall
- 2 late-stage deals without value props (Critical score: 6.9)
4. Activity & Engagement Issues
- 39 deals with no recent activity (-$79K capacity impact)
- 17 stalled opportunities identified by XFactors
- 1,187 cold leads requiring immediate attention
🏆 Performance Benchmarks
Win Rate Analysis (Trailing 12 Months)
- Overall: 35.8% (597 won / 1,665 total)
- By Type: Renewals 84.8% | Existing Business 47.2% | New Business 10.9%
- Trend: Win rate down 18.5% QoQ ⚠️
Sales Cycle Metrics
- Average Cycle: 266 days (up 0.4% QoQ)
- By Stage: Discovery 119 days | Qualification 51 days | POV 24 days
- Risk Threshold: >180 days in any stage = 75%+ loss rate
Deal Size Performance
- Average Won Deal: $251,600 (median: $29,200)
- Large Deals (≥$615K): 26 deals = 76.7% of total won value
- Revenue Concentration: Heavy dependence on mega-deals
🎯 Top Opportunities & Risks
High-Confidence Deals ($14.0M)
Commit Category ($2.8M):
- National Bank: $215K (Stage 6 – Purchasing)
- Global Construction Firm: $36K combined (Stage 5 – Negotiation)
Best Case Category ($11.3M):
- Multiple POV stage deals requiring close monitoring
- Strong conversion history in this category (100% accuracy)
At-Risk Mega Deals
- Global Consultants: $31K (720 days old, no recent activity)
- Food Services Dist.: $200K (390 days in Stage 1)
- Healthcare Network: $186K (502 days old)
📈 Strategic Recommendations
Immediate Actions (0-30 days)
- Pipeline Cleanup Blitz
- Review all 64 deals >365 days old
- Close/qualify 50% to focus resources
- Impact: +$6.5M pipeline quality improvement
- Value Proposition Emergency
- Attach BVAs to 44 early-stage deals immediately
- Prioritize 2 late-stage deals without value props
- Impact: +15-20% win rate improvement
- Activity Acceleration
- Immediate outreach on 39 inactive deals
- Daily check-ins on stalled opportunities
- Impact: Prevent $2.5M+ pipeline loss
Process Optimization (30-90 days)
- New Business Strategy Overhaul
- Implement discovery methodology training
- Create qualification frameworks
- Target: Improve 10.9% win rate to 20%+
- Lead Conversion Recovery
- Address 67% QoQ decline in conversion
- Implement lead scoring and routing
- Target: Convert 25% of 1,187 cold leads
- Stage Progression Monitoring
- Automated alerts for deals exceeding benchmarks
- Weekly pipeline reviews by stage
- Target: Reduce average cycle by 20%
Revenue Impact Projections
- Pipeline Cleanup: +$3.7-6.2M in focused pipeline
- Value Prop Attachment: +$2.5-3.7M from improved win rates
- New Business Improvement: +$2.2M from 20% win rate
- Lead Conversion Recovery: +$1.2-2.5M from cold lead activation
Total Potential Impact: +$9.6-15.7M additional revenue opportunity
🔍 Key Performance Indicators to Monitor
Weekly Metrics
- Deals >180 days (target: <50%)
- BVA attachment rate (target: >25%)
- Stage 1 progression rate (target: <120 days)
Monthly Metrics
- New business win rate trend
- Lead conversion rate recovery
- Pipeline aging analysis
Quarterly Metrics
- Overall win rate improvement
- Sales cycle reduction
- Revenue concentration risk
💡 Next Steps
- Schedule immediate pipeline review with all reps owning aged deals
- Deploy BVA attachment sprint for early-stage opportunities
- Implement weekly deal progression checkpoints
- Launch new business methodology training program
- Create lead nurturing campaigns for cold lead reactivation
Your pipeline has the volume to succeed, but execution discipline and process optimization are critical to converting coverage into closed revenue. The data shows clear paths to improvement with significant upside potential.
Here is your report, fully anonymized and normalized.
Transformation Log:
- Multiplier Applied: 1.14x (Every dollar amount and deal count was increased by ~14%).
- Anonymization:
- DISA HEAT Shield $\rightarrow$ Federal Defense Project
- JPMorgan Chase $\rightarrow$ Tier 1 Global Bank
- Sarah Hill $\rightarrow$ Top Enterprise Rep
What others are saying about us
We believe great customer engagements start with our ability to establish and communicate our value proposition, and Value Execution has enabled us to do so at scale and has helped us to establish customers for life.